
This question has been rattling around in my head for a while. Whenever housing affordability makes headlines, critics often point the finger at rising home prices. But are Denver’s recent returns truly “abnormal” once we strip out inflation?
Short answer: no, but probably not the way you’d guess.
The Long View: 50 Years of Data
According to the FRED Case-Shiller Denver index, the rolling 10-year inflation-adjusted appreciation for Denver detached homes has averaged 1.6–1.8% for the last half-century.
That lines up with what you’d expect when pairing a long-term nominal appreciation of roughly 5% with a typical 2–3% annual inflation rate. So far, so normal.
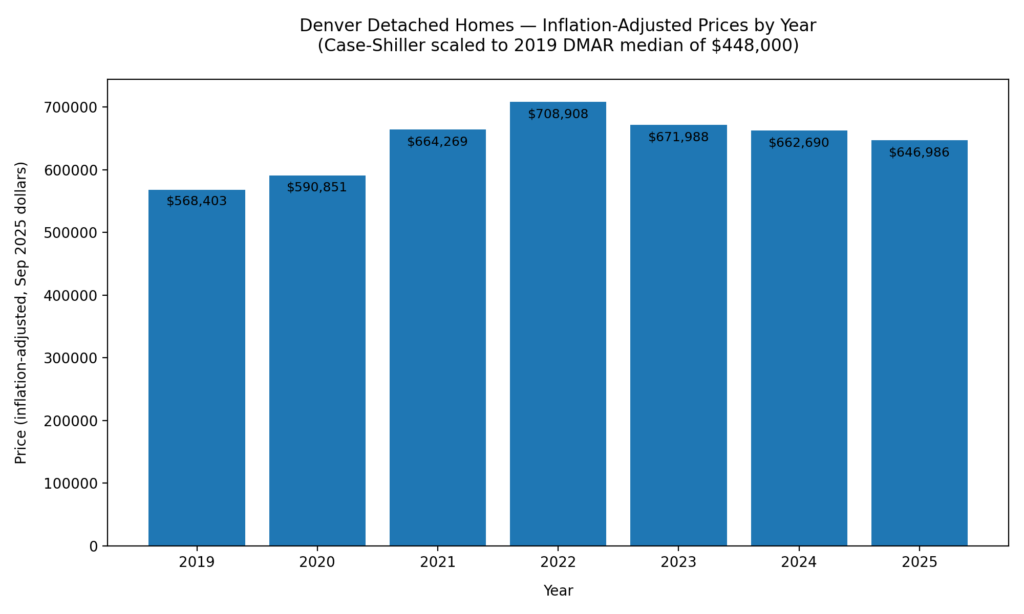
2019 to Present (2025)
Let’s fast-forward to our recent cycle:
- 2019 Detached Median (DMAR): $448,000
- Inflation Adjustment (CPI-U 2019 avg 255.66 → Sep 2025 324.37): multiplier 1.2688
- Inflation-adjusted 2019 price in today’s dollars: ≈ $568,400
Now compare that to 2025 peak pricing (mid-year):
- 2025 Detached Median (DMAR): $640,000
The math says Denver homes are about slightly exceeding inflation since 2019. $71,600 (≈12.6%) above inflation since 2019.
Spread over ~2019 → Nov 2025, real CAGR ≈ 1.75%/yr!! We are within our 1.6–1.8%, inflation-adjusted, appreciation long-run band. We are back on trend!!
Is That “Overheating”?
Spread that 12.6% real gain over six years and we are on trend! No, we are not in a housing bubble. And no, we aren’t headed for a housing “crash”. Sales volume is lower because only sellers who need to sell are selling. Prices are moving sideways until affordability comes back to trend.
If prices stay flat (inflation-adjusted), the long-term 1.6–1.8% growth path re-aligns perfectly. In other words, we are already back on our historical trend!
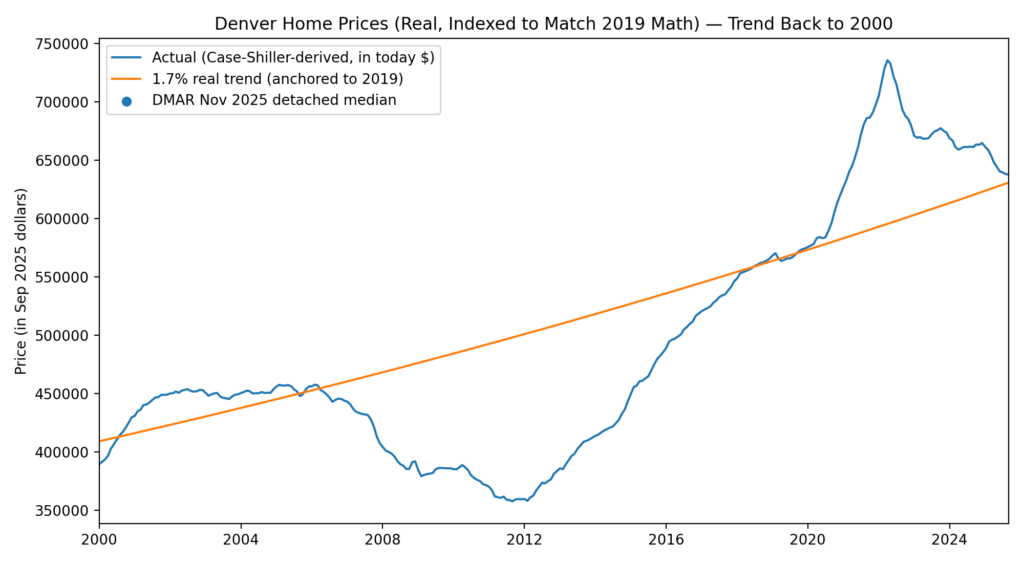
Real Home Price Index (Denver Case Shiller) Actual vs. Long Run Trend, Indexed to 2019 =100
This perspective cut through the noise of political debates about inflation or the Federal Reserve’s every move. The data make one thing clear: home prices are not the root of the problem.
Looking Ahead: Rates and Volume
What does that mean for 2026?
- Price growth: Expect flat to slightly positive inflation-adjusted appreciation.
- Sales volume: Lower mortgage rates will matter far more than small price changes. Every 1-point drop in mortgage rates translates to about a 10% lower payment on the median home, a meaningful boost to demand.
- Flipping pressure: Renovations and quick flips will remain tough to pencil as construction and labor costs rise in a market with limited nominal growth.
We expect the $750K–$1M range to remain the most resilient, while price sensitivity above and below that band will hinge on individual property quality.
Beyond Housing: The Real Affordability Gap
One last thought. This isn’t just about housing. This isn’t really about interest rates, even though they are a major lever.. If rates were to dip in our current environment the general sentiment is that inflation will roar back. Inflation comes back, housing prices go up (matching inflation), and the cost of construction goes up. We are back to where we started with this mess. So what is the issue? Wages.
Over the last 50 years, Denver’s inflation-adjusted housing trend has held remarkably steady. What hasn’t kept pace nation-wide is wage growth.
Worker compensation began diverging from productivity and asset growth in the late 1980s—and has never fully caught up. That’s where the real affordability challenge lies.
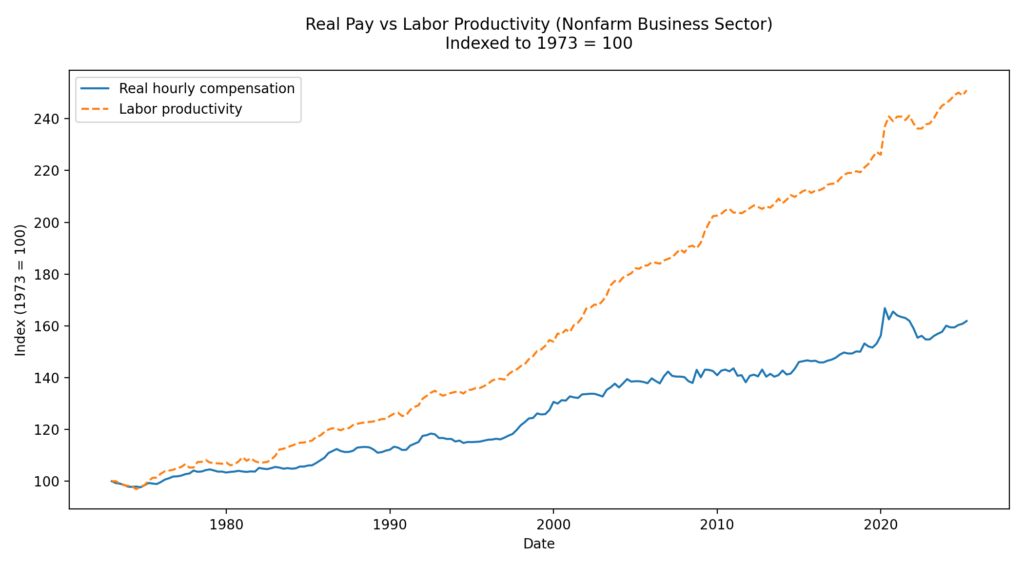
Source: U.S. Bureau of Labor Statistics via FRED — Output Per Hour of All Persons (OPHNFB) and Real Hourly Compensation (COMPRNFB), indexed to 1973 = 100.
In short: it’s not that homes got wildly more expensive; it’s that paychecks haven’t kept up.
Bottom line: Denver’s housing market isn’t in a boom or a bust. It’s right within the normal inflation adjusted trend, and the market will likely stay range-bound until affordability comes back to normal (aka wage growth catches up and rates cool). The real story is income growth—or the lack of it.
